Ecommerce Analytics
Ecommerce Analytics is a set of tools for reporting visitor metrics, identifying order trends, shaping merchandising strategies, and helping maximize the efficacy of your marketing campaigns. You'll be able to measure merchandising performance down to the SKU level and customize date ranges to see if the time of year impacts your sales, along with the ability to access customer, marketing, and merchandising data all in one dashboard.
You will be able to analyze customer segments to uncover your biggest spenders or highest-valued customers, which will provide data that can then be used to optimize your marketing campaigns to attract even more revenue.
Access to a comprehensive, end-to-end view of customer engagement and revenue across all of your marketing channels available in one place means you'll spend less time with your data, and more time putting its intelligence to use. By understanding your store’s performance, you will save time, resources, and money.
Ecommerce Analytics is available to all stores, regardless of plan. Note that Ecommerce Analytics will not be enabled if you have chosen to disable analytics cookies.
Ecommerce Analytics Reports
The built-in analytics suite consists of 11 reports tailored for the various aspects of your store, ranging from merchandising to shopper behavior. We also have a premium offering, Ecommerce Insights, which analyzes all your store data and makes suggestions for improving your business.
- Store Overview Report — Access a comprehensive view of your entire business across all key metrics, view of your purchase funnel, abandoned carts, top products, and sales by marketing channels.
- Real Time Report — Keep track of revenue, orders, and on-site visitors second-by-second. Monitor in real-time the effects of any email campaign or new offer launched across social media channels.
- Merchandising Report — Keep track of sales by products, all the way down to the SKU level.
- Marketing Report — Access all of your marketing activity in one place, detailed down to each email campaign you send.
- Orders Report — View all orders in your business in detail with one-click access to the various aspects of each order.
- Customers Report — View your progress in bringing new versus repeat customers to your business. Click through to view all purchase behavior of any customer across their lifetime with your business.
- Purchase Funnel Report — Understand the shopping behavior of visitors to your site. Determine if people are getting stuck at various stages of the shopping experience.
- Carts Report — Find the products that people are most often leaving in their shopping carts so you can A/B test with different product images, descriptions, and prices and view the details of successfully converted abandoned carts and the total value of the sales that have been saved.
- In-Store Search Report — Uncover what your shoppers are looking for and tailor their experience when using your in-store search functionality.
- Sales Tax Report — Keep track of which orders had taxes applied to them, the jurisdiction of those taxes, and the rate that was used.
- Ecommerce Insights — This premium offering, which is sold separately, analyzes your store data, and makes suggestions for improving your conversion rate and customer loyalty.
Eligible Order Types and Statuses
Orders from the following origins are included in Ecommerce Analytics Reports. Note that non-storefront orders will NOT be included in the Purchase Funnel Report.
- storefront
- control panel (manual orders)
- eBay
- Amazon
- Buy Button
- third-party programs (API)
Eligible Order Statuses
Orders with the following statuses will be included in Analytics reports. Note that archived orders will not be included.
- Awaiting Fulfillment
- Awaiting Shipment
- Awaiting Pickup
- Completed
- Shipped
- Partially Shipped
- Partially Refunded
Analytics reports do not count orders that are in the following statuses:
- Pending
- Awaiting Payment
- Cancelled
- Declined
- Refunded
- Disputed
- Verification Required
Analytics not tracking? If you've changed your order status labels, know that analytics will continue to track orders based on their original name. For example, renaming the "Pending" status to "Completed" would still count as "Pending" for analytics. See Troubleshooting | Ecommerce Analytics for additional troubleshooting steps and common questions.
Timestamp
The majority of Analytics reports will update in near real time (less than 60 seconds). This includes:
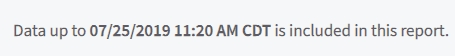
A timestamp at the bottom of each report (except Real Time, Abandoned Cart Recovery, In-Store Search and Sales Tax Report) displays the last time the data was updated. The time zone can be changed by editing the date settings in the control panel.
Date Range Selector and Comparison
Each report (except Real Time) includes a date range selector to display data from a particular period. There are several preset date ranges you can choose from.
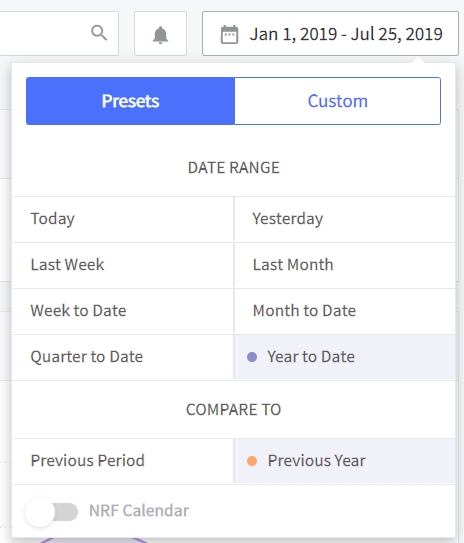
Pro Tip! You can toggle on the NRF calendar, a 5-4-5 week calendar used by the National Retail Federation. Learn more about the NRF Calendar.
If you prefer, you can select a custom date range by clicking on Custom and selecting your dates from the calendar.
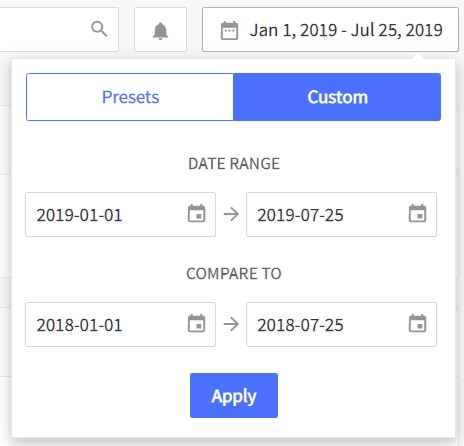
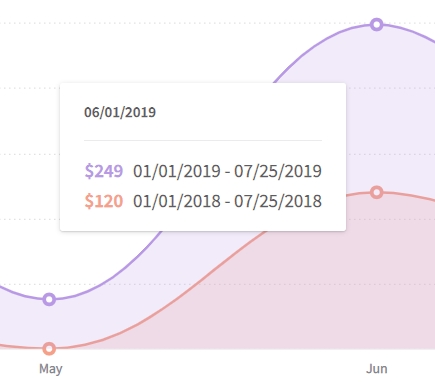
You can also compare your report to another date range. For example, you could compare the Revenue chart from the current month to date with the previous month within the same period. When comparing, your current period will be marked in purple and your new period will be in orange. Each metric will display both the selected date range and the percentage change over the previous period.
You can choose any of the following comparison periods:
- Previous period (which uses the same preset or custom date you've already selected)
- Previous year
- Custom range
Graphs
Some reports include graphs which will present extra data when hovering your mouse over a point on the graph.
Exporting Reports
You may find it useful to export your Ecommerce Analytics data to a spreadsheet and transfer the data to an accounting or customer management application. The data tables in the following reports can be exported to a CSV file:
Exporting Your Report
Select the date range for the data table you want to export.

Click the Download CSV button at the top right of your data table.

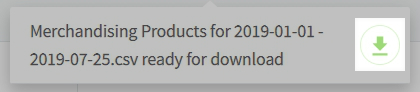
You will see a message that the export is getting generated.
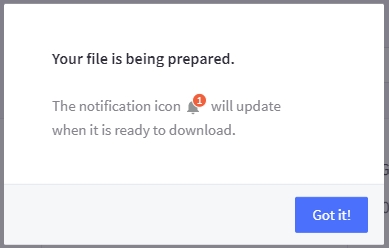
The notification icon will update when the report is ready for download.

Click the notification icon once it indicates that your report is prepared. Then click on the green download file, and you will be prompted to save the CSV to your computer.
Permissions
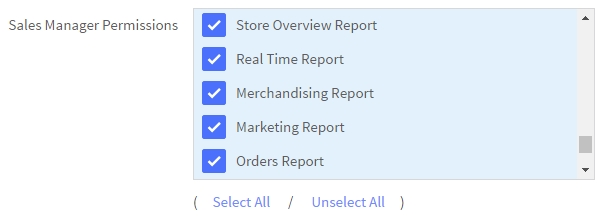
By default, only store owners can see Ecommerce Analytics reports. To allow other users to see them, you can edit the users to give them access. Select the permissions located at the bottom of the "Sales Manager Permissions" list; each report is an individual permission.
FAQ
Is store credit accounted for in analytics?
No. The order total and revenue metrics only track the amount paid for by the customer. Store credit is also not considered a discount, so it will not be displayed in the Discounts column. However, store credit is an exportable field and can be included in an order export. See Exporting Orders for more information.
Why does an order show as unattributed?
Unattributed means we weren't able to attribute the order to a specific marketing channel. See the Marketing Report for a complete breakdown of each channel.
What are the differences between Ecommerce Analytics and Google Analytics?
The key differences are in the type of information each tool provides, how the information is presented, and the level of detail to which merchants can drill down. See Guide to Google Analytics to learn more.
What are the differences between Ecommerce Analytics and Store Performance?
The dashboard Store Performance report and the Ecommerce Analytics reports pull data from the same analytics database and calculate metrics the same way. Any differences will be visual only. See Store Performance Report for more information on this feature.
How accurate are analytics reports when using BigCommerce as a headless solution?
If you are using a headless solution, you will see a discrepancy in any analytics based on data, such as visits, conversion rates, and abandoned carts. This is due to your store's frontend being hosted on a different platform.
We recommend setting up Cross Domain Tracking in Google Analytics for accurate analytics on a headless store.