Optimize Product Pages for AOV
Chapter 3 (View all Chapters)
Optimize Your Product Pages for Increased AOV
Product Insights can not only help you optimize product pages for conversion, but also help increase average order value (AOV). Before we get started, let's talk more about average order value as it is one of the most important metrics to track.
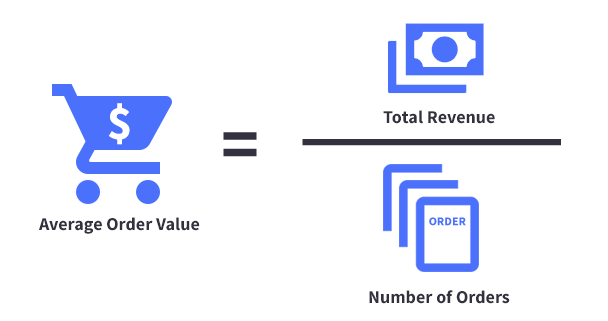
What is AOV?
Average Order Value (AOV) is a performance metric that measures the average dollar amount spent each time a customer places an order over a defined period. AOV can give you insight into your customers' purchasing habits, how much you spend to acquire new customers and your return on investment (ROI) with your marketing efforts.
Optimizing for average order value will increase revenue from customers already buying from you. 80% of your store's revenue will come from 20% of your current customers.
How to Improve AOV
A straightforward way to improve AOV is by suggesting complementary or similar products on your product pages. As you would expect, product pages provide an excellent opportunity to persuade shoppers to add additional items to their carts. They are the perfect avenue to cross-sell and upsell as shoppers are just a few steps away from checking out.
Cross-selling is a way of suggesting complementary items in a bid to drive customers to spend more than they initially thought they would pay. It is a great tactic to improve AOV and build customer relationships. It can alert shoppers to products they did not realize they would need or point them to products they would have purchased anyhow. Being offered fries and a drink when buying a burger would be an example of cross-selling.

Upselling is a strategy to add extra features that offer more value, or upgrades to a more expensive version of a product. Presenting other versions or models that better fulfill their needs can increase AOV and help shoppers walk away more satisfied with their purchase. Upselling provides an opportunity to build deeper relationships with your customers by delivering more value. Being offered an upsize to your order at the drive-through window would be an example of upselling.
In both cases, the objective is to help the customer get more value from your business and build loyalty and revenue from the customer. The key to success is to present products and features that truly meet the needs of your customers.
Suggesting Complementary or Similar Products
Your product pages have several built-in areas that show similar or related products to shoppers. They can be enabled in the Products menu of Page Builder. However, not all areas are available in all themes.
For more information about what is included under Page Builder, check the theme's manual available on Storefront › Themes.
Using Multi-Storefront? Each storefront's themes are located in the storefront-specific settings within Channel Manager. See Single-Storefront vs. Multi-Storefront for more information.
For more information about adding product panels to the rest of your store see Product Panels.
Each panel uses a different algorithm to determine its relatedness to a particular product. The panels are:
- Related Products — This panel can show up to five related products that are chosen automatically, or as many products as you want if chosen manually.
- You May Also Like — This panel shows suggested products based on the same algorithm used by Related Products, i.e. similar product names and descriptions.
- Similar Products by Category — The similar products panel displays the categories that your product belongs to.
- Most Popular Products — The products that appear under Most Popular Products are chosen by calculating which products have been ordered the most in your store.
How to Leverage Product Insights
There is no one-size-fits-all solution to creating useful product recommendations, as every store offers a different mix of products and caters to their own particular demographic. However, by leveraging the Products Purchased Together report, you can deliver product recommendations that are highly relevant to your shoppers.
The Products Purchased Together report will show your top selling products and the related products which are most frequently purchased with them. Use this report to find the highest percentage of products purchased together (using the high % column) to fuel your similar and related product panels. When reviewing this report, be on the lookout for patterns. A product may show up as a relevant product for more than one result.

You can use these patterns to configure your product recommendations intelligently. For example, in the above image, we see that the Colorant Starter Set is often purchased with Paint Colorants. Further down the list, we know the Colorant Starter Set is also frequently purchased along with the Rack for 12 tubes. We can use this information to customize the Paint Colorants related product panel to display both the Colorant Starter Set and the Rack for 12 tubes. The Products Purchased Together report is updated weekly so be sure to look at your past weeks to get the full picture of your product performance.
Another method for improving average order value is by segmenting your customers into multiple groups based on their purchase history. You can then tailor your advertising to those groups. Big spenders and frequent customers can be entered into a "VIP" rewards group, while low spenders can be targeted with offers to try and improve their value or to off-load excess inventory. We will go into more detail in the following chapters.
- Unlimited Upsell (BigCommerce App Marketplace)