Optimize Product Pages for Conversion
Chapter 2 (View all Chapters)
Optimize Your Product Pages for Conversion
The Product Insights reports can help you in quickly identifying which products are performing well and which need attention. Identifying products that are underperforming allows you to explore the causes behind the poor performance and start experimenting with those products.
Getting Started
Don't know where to begin? Start by examining the products that are not selling at all and comparing them to those that are already top performers. The Rockstar Products report will show you which products are your most visited, best converting products.
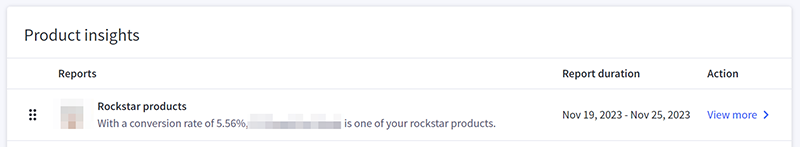
You will see the top 10% most visited products, sorted by best to worst conversion rate. You may be tempted to only focus on the conversion rate, but be sure to look at all the metrics in this report to get a better understanding of what is working for you. These products are performing well for a reason. Study their product pages and use them as a benchmark for all your other products.
The Non-Sellers report will show you which products are not selling at all. You will see the products with zero orders, sorted by most to least visits. The products at the top of the list are good candidates for improvement.

When comparing these product pages to your rockstars, consider the following:
- Are the product images comparable?
- Are the product descriptions well written?
- Are non-sellers discounted more often than your Rockstar Products?
- Are the calls-to-action similar?
The next report you will want to look at is the Products To Improve report. These are your top 10% most visited products, filtered to those above average conversion rate. Sorted by conversion rate from worst to best. As with the Non-Sellers report, the products at the top of the list are good candidates for improvement.

Again, ask yourself the following questions when comparing these products to your rockstars:
- Am I using high-quality imagery?
- Do my product descriptions provide enough information?
- Do my product descriptions tell a story or invoke a need?
- Do my product pages add urgency?
Dive Deeper into Your Store Performance
Once you have a handle on which products need the most attention, you can switch focus and dive deeper into your store performance by examining the Cold Products and Hot Products reports.
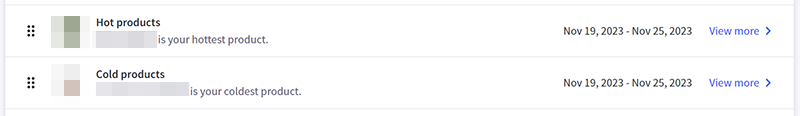
Hot Products are products that had the most revenue growth from the week prior. They are calculated by sorting products by revenue growth in absolute terms (i.e. dollar growth, not percentage growth).
Cold Products are products that had the largest revenue drop from the week prior. They are calculated by sorting products by revenue growth in absolute terms (i.e. dollar growth, not percentage growth).
These reports can put a spotlight on trends that you might not have noticed. Catching these patterns can help you make the most of your ad spend and help save products from turning into non-sellers. For example, you can use your hot products to cross sell and up sell or even bundle them with rockstar products.
Similarly, you could discount your cold products, and promote them to customers that only purchase discounted items. We will discuss this in more detail in the following chapters.
- Ecommerce Insights
- Using Ecommerce Analytics
- 28 Ecommerce Conversion Rate Optimization Steps Guaranteed to Increase Sales in 2017 (BigCommerce Blog)
- How to Use Psychology & Sales Triggers to Double Your Conversion Rate (BigCommerce Blog)
- Ecommerce Product Page Examples and Best Practices (BigCommerce Blog)